
Is Your SEM Scale Bar Right? Checking Magnification Against a Certified Standard
We measured a NIST-traceable calibration standard across a zoom series from 80× to 600,000×. Everywhere we could measure well, the scale bar was within 1.6%.
Every size an SEM reports, from a particle diameter to a coating thickness to a crack length, depends on the scale bar being right. That's why we keep a NIST-traceable calibration standard: a chip with line patterns of certified spacing, from 2 mm down to 100 nm.
This note looks at one image series of that standard, taken across nearly the full magnification range in a single session, from a view of the whole chip at 80× down to a handful of 100 nm lines at 600,000×. We measured every certified pattern in it and asked a simple question: how closely did the scale bar match the certified dimensions at each magnification?
It's a focused look at one data set, not a full calibration study. A formal study would add repeat images, both scan directions, and centered patterns at every magnification, and we describe what that would look like at the end. But a single series spanning this range turned out to show something worth knowing whenever a dimension matters: scale accuracy isn't necessarily the same at every magnification.
The standard
We used a Pelcotec critical dimension standard (CDMS-0.1T, made by AISthesis Products for Ted Pella). It carries nested sets of parallel lines with pitches from 2 mm down to 100 nm. Its certificate of traceability gives the average pitch of each set, measured against working standards traceable to the National Institute of Standards and Technology (NIST), with an expanded uncertainty. For the 100 nm set, for example, the certified average pitch is 99.8 ± 0.75 nm, about ±0.7%.
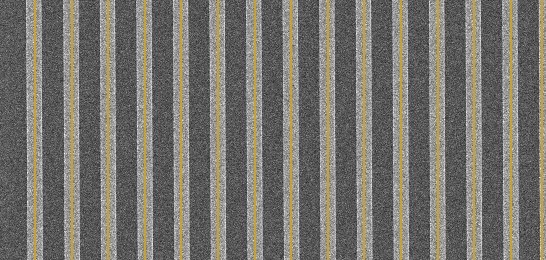
Because the patterns are nested, one sample covers almost the whole magnification range. Here it is from 80× to 600,000×:
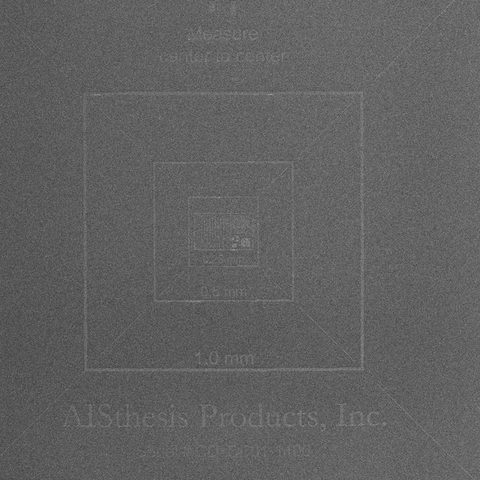
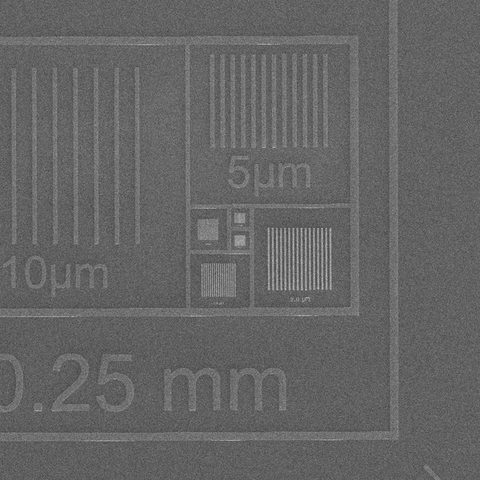
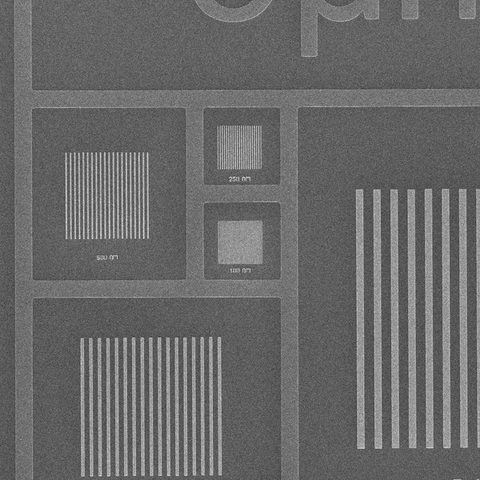
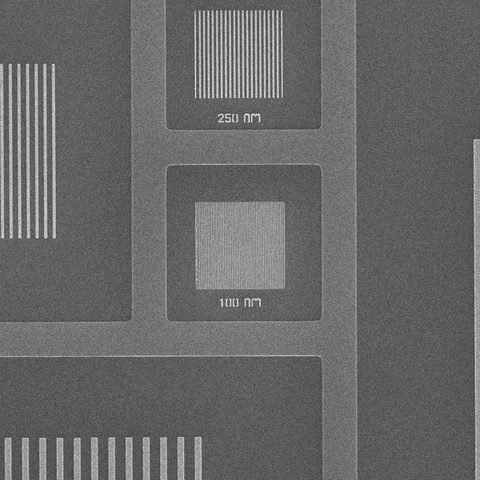
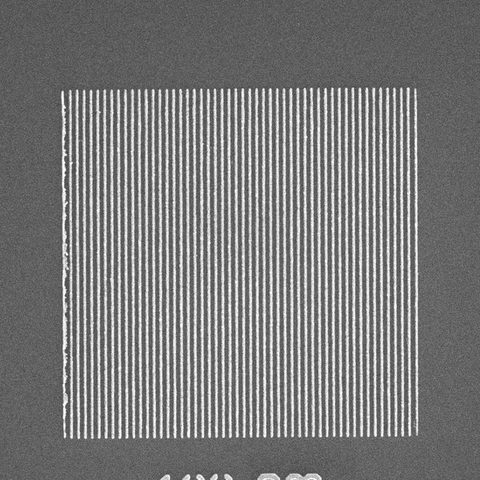
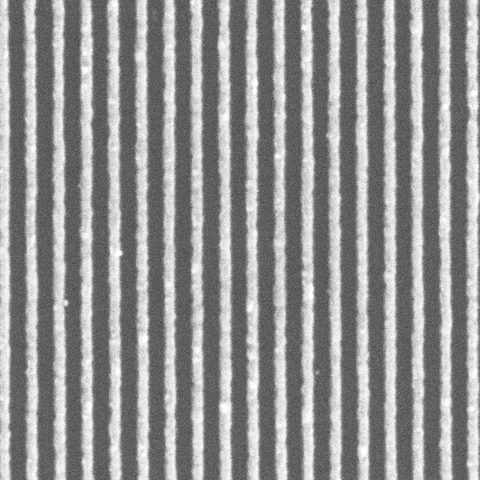
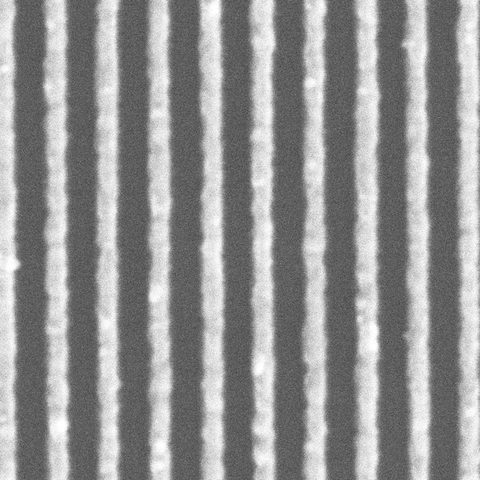
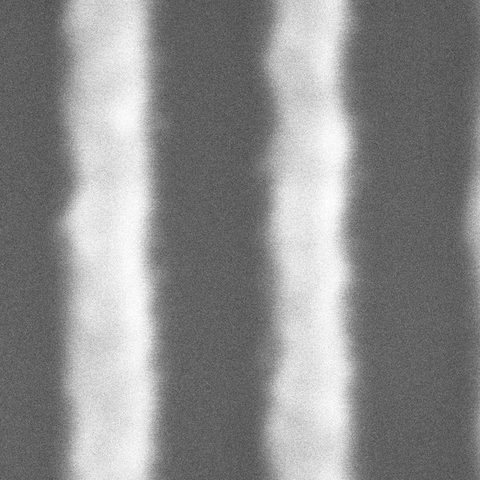
The same standard at eight magnifications, cropped square. Field widths are from the instrument's image metadata.
Measure pitch, center to center
There are two things you could measure on a line pattern: the width of a line, or the distance from one line to the next. Only the second is a good test of the scale.
A line's apparent width depends on focus, beam spot size, how the electrons scatter at the edge, and where you decide the edge is. None of that is a scale error, but all of it changes the number. The distance between line centers is different: those effects broaden both edges of every line equally, so the centers don't move. That is why the standard is certified by pitch, and why its label says to measure center to center.
We found each line's center as the midpoint between its two edges at half the line's peak brightness, with sub-pixel interpolation. We then fit a straight line to center position against line number. The slope of that fit is the pitch, averaged over every line in the image, which is far more reliable than measuring one gap.
What we found
| Magnification | Pattern | Certified pitch | Lines | Measured | Difference |
|---|---|---|---|---|---|
| 600,000× | 100 nm | 99.8 ± 0.75 nm | 4 | 97.4 nm | −2.4% |
| 300,000× | 100 nm | 99.8 ± 0.75 nm | 7 | 98.0 nm | −1.8% |
| 150,000× | 100 nm | 99.8 ± 0.75 nm | 14 | 99.2 nm | −0.6% ✓ |
| 80,000× | 100 nm | 99.8 ± 0.75 nm | 26 | 99.2 nm | −0.6% ✓ |
| 40,000× | 100 nm | 99.8 ± 0.75 nm | 50 | 99.4 nm | −0.4% ✓ |
| 5,000× | 250 nm | 249.6 ± 1.75 nm | 21 | 248.7 nm | −0.4% ✓ |
| 5,000× | 500 nm | 498.5 ± 3.5 nm | 20 | 499.7 nm | +0.2% ✓ |
| 5,000× | 1 µm | 1.00 ± 0.007 µm | 17 | 0.996 µm | −0.4% ✓ |
| 2,500× | 500 nm | 498.5 ± 3.5 nm | 20 | 493.3 nm | −1.0% |
| 2,500× | 1 µm | 1.00 ± 0.007 µm | 17 | 0.986 µm | −1.4% |
| 2,500× | 2 µm | 2.00 ± 0.014 µm | 15 | 1.968 µm | −1.6% |
| 1,300× | 1 µm | 1.00 ± 0.007 µm | 17 | 0.987 µm | −1.3% |
| 1,300× | 2 µm | 2.00 ± 0.014 µm | 16 | 1.974 µm | −1.3% |
| 600× | 5 µm | 5.00 ± 0.035 µm | 12 | 4.936 µm | −1.3% |
| 600× | 10 µm | 10.00 ± 0.035 µm | 9 | 9.876 µm | −1.2% |
✓ = the measured pitch falls within the certificate's stated uncertainty for that pattern. Certified values and uncertainties (3σ) are from the standard's certificate of traceability.
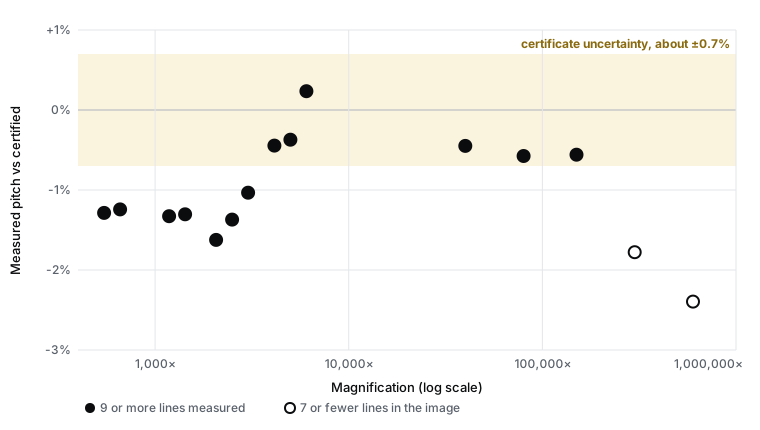
The short version: wherever the images held enough lines to measure well, the scale bar was within 1.6% of the certified value, and from 5,000× to 150,000× it was within the standard's own uncertainty.
- From 5,000× to 150,000×, within the certificate. Every measurement fell inside the certificate's uncertainty, with the largest difference 0.6%. Four different patterns, from 100 nm to 1 µm, agree.
- At 2,500× and below, about 1.3% small. Seven measurements on five different patterns read between 1.0% and 1.6% short. A feature that is truly 100.0 µm across would have measured about 98.7 µm at 1,300×.
- At 300,000× and 600,000×, too few lines to say. Only four to seven lines fit in those images, and the spacing between neighboring lines varies by a few nanometers from line-edge roughness and drift, so those two results aren't precise enough to compare with the certificate.
Where the difference comes from
We checked the obvious suspects. It isn't the standard: the certificate puts the pitch variation within each pattern at 0.1% to 0.2%, and the same 1 µm pattern measured 0.4% small at 5,000× but 1.4% small at 2,500×. It isn't the analysis: the same method lands inside the certificate at higher magnification, the low-magnification patterns are well sampled, and the lines were within 0.35° of vertical, which is negligible. And it isn't a change in stage tilt, working distance, or lens settings, which were identical for every image.
That leaves a small difference in the microscope's magnification calibration between low and high magnification that day, possibly with some distortion toward the edges of a large field of view, since a few of the low-magnification patterns sat off-center. Calibrations are adjusted during routine service, so one session describes that session, not the instrument from then on.
Does 1% matter?
For a lot of SEM work, it doesn't. Seeing what a fracture surface looks like, finding a contaminant, comparing a good part with a bad one, or sizing particles to see whether a batch changed are all unaffected by a percent or two.
For some work it matters a great deal. A 1.3% difference turns a 50.0 µm coating into 49.4 µm. If that coating has a tolerance of ±1 µm, the scale alone uses up more than half of it. Coating thicknesses, critical dimensions, and anything else measured against a tight specification need the scale checked, not assumed, and that's how we handle them (more on that below). One check at one magnification isn't enough either: a check at 50,000× would have passed here, while measurements at 1,000× were still about 1% small.
What a full study would add
This series covered the whole magnification range in one session, which is what made the comparison possible, but it wasn't designed as a calibration study, so a few questions stay open. A full study would center each pattern in the field of view to separate scale from edge distortion, image every pattern at more than one magnification (the 1 µm pattern at 5,000× and 2,500× was the most telling comparison here), repeat each image, and measure the vertical direction as well as the horizontal. At the highest magnifications it would use drift correction, so that more lines fit in a stable frame.
How we use this for client work
When a dimension is going to be held against a specification, we image the certified standard in the same session, at the same magnification and working distance as your samples, and report the check alongside your measurements. If a correction is needed, you'll see it and know why. If your project needs it, just mention it when you request a quote and we'll include it in the quote. You can see how we present a calibration measurement in our example report.
SEM measurements you can rely on
SEM imaging and EDS scoped by a PhD scientist, with fixed quotes and no minimum job size.
Method details
All images were acquired in one session on May 3, 2025, with secondary electron imaging at 20 kV and a working distance of 9.5 mm, at 1536 × 1094 pixels. Each image is a single 4.8-second frame with no frame integration, and drift correction was off. Pixel sizes are from the instrument's image metadata. For each pattern, rows were averaged in ten bands across the lines. Line centers are the midpoints of each line's half-maximum edges, interpolated to sub-pixel precision, and the pitch is the slope of a straight-line fit of center position against line number. Reported values are the mean of the ten bands; the spread between bands was below 0.2% in every case, so the differences above are not noise in the image. The stage was untilted and the working distance and lens settings were the same for every image. Line rotation, measured from the change in each line's center between bands, was 0.2° to 0.35° and is negligible. Only the horizontal scan direction was measured. Certified values are from the standard's certificate of traceability (wafer CD-DF01, April 7, 2025).
References
- AISthesis Products, Inc., Wafer Level Certificate of Traceability for Pelcotec Critical Dimension Standard, product 683-01 CDMS-0.1T, wafer CD-DF01 (April 7, 2025). Distributed by Ted Pella, Inc.